Hi there! My name is James Cover. I’m a Data Science Major at the University of Nebraska-Lincoln with Minors in Computer Science, Mathematics, and Engineering Leadership, and I’m also a part of Engineering Ambassadors and the Engineering Student Advisory Board.
In my experience, I’ve worked as a Data Scientist, Business Analyst, and Researcher. Look below to see the kinds of projects I’ve worked on over my career!


Data Science |
CompanyCam |
Data Science | CompanyCam |

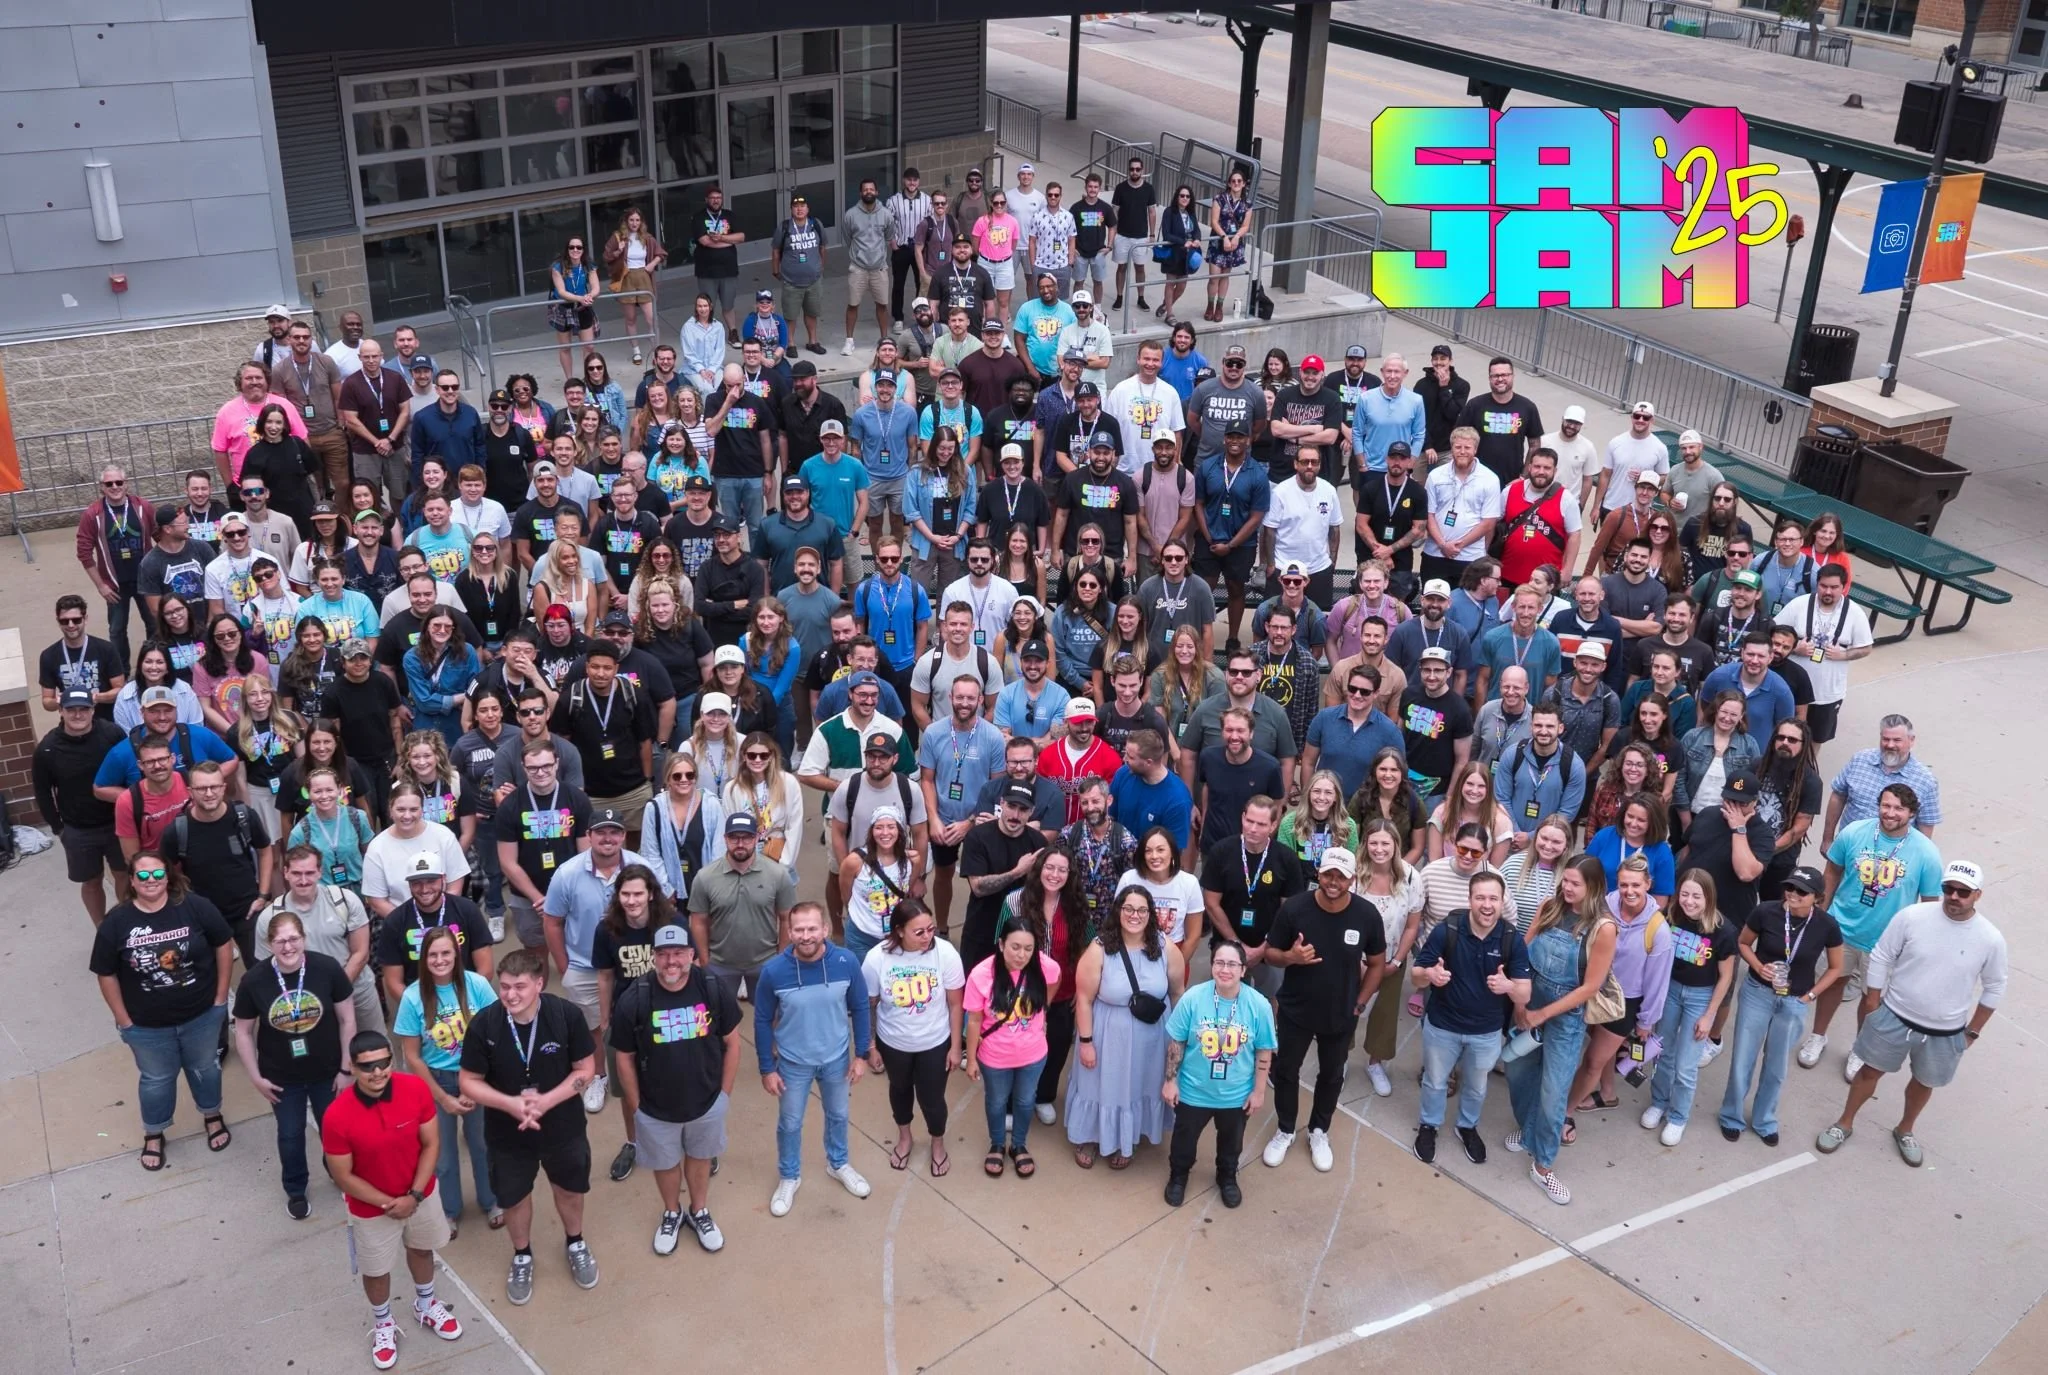
My time as a Data Science Intern at CompanyCam was the experience of a lifetime. I created many meaningful relationships and was lucky enough to be around for CamJam, a company-wide celebration. I also walked away with experience in Artificial Intelligence, Machine Learning, Data Analysis, Database Development, Data Pipelines, and more!
My main role as a Data Scientist was working with the Data and Engineering teams to create modular Machine Learning pipelines that produced actionable data-insights that were used by the CS team to drive new initiatives for customer expansion and retention. With those insights, I was able to conduct Data Analysis and query specific customers and companies to contact. I also designed personalized visualizations and Dashboards for coworkers all across the company!

Business Analysis |
Sandhills Global |
Business Analysis | Sandhills Global |
At Sandhills Global, I worked as a Business Analyst where my main role was creating and using data-driven insights to develop internal and external CRM interfaces for new AI features and API integration. This way, we designed a better platform for our customer interaction. Along with that, I designed websites that enhanced inter-departmental communication and increased customer traffic.
This is Sandhills Global’s main webpage, therefore working on it felt like it was the biggest project of my career. The marketing team was pushing to make the website feel more “interactive” and “eye-popping” so the team discussed creating a new UX where the first page would be a video imagining how complex data being given to Sandhills was distributed to buyers and sellers in a simple yet effective way. I had to find images and videos that aligned with the color scheme of the current website to keep that “data driven” feel and came up with this finished project. I pitched the idea of sliding transitions between pages to feel less stagnant and more interactive, and the idea was used.
Machinery Trader was my favorite project. After running an analysis and finding that customer interaction was at a low for the Machinery Trader website, I went in and found that images weren’t updating. I went into the code and found that there was an error where if the date of the image upload was past a certain date, it wouldn’t display. After making that update, I suggested that we revamp the website, and I asked if I could take control for the update. I had a vision for the “New & Used Construction Equipment For Sale” UI where I could have a transparent silhouette for each machine. I edited an image for each machine and replaced the old compressed images with the ones you see in the video. I also added red highlight under each image when a customer would hover over. The images linked the user to the site with the machinery they selected. The rest of the edits were updating images, color schemes, and font/spacing. The website eventually returned to its high level of traffic!
My department developed the Equipment Facts website from the ground-up. The overall architecture of the website is very minimal, but that was because we wanted to produce an easy, straightforward, auction-style marketplace for equipment being advertised by Sandhills customers that wasn’t overly complicated to accommodate for user preferences. I had detected an issue with how the bidding action was being recorded, and determined it was from a recent update that had reformatted some code that went unnoticed until deployed to Live. After fixing that issue, I asked if I could make an update to the UI. I pitched my idea of having a moving bicolor line for the progress bar to have a more “live” and “time-sensitive” feel for users contemplating about engaging in an auction. I also helped with the design of the autofill animation in the search bar.
Research |
University of Nebraska-Lincoln |
Research | University of Nebraska-Lincoln |
At the University of Nebraska-Lincoln, I started my design and data career by leveraging AI to find routes to mitigate the impact of large-scale disruptions (such as a pandemic, natural disaster, etc.) on students and faculty in Higher Education environments. Using k-means clustering and predictive modeling, we detected clusters of faculty who use their Learning Management System differently. By doing so, we could create professional development in a way that improved instructor ability to interact with the LMS’s UI in their preferred method. In doing so, we found feature use trends throughout our research timeline that tipped us where to look.
As part of my research, I was able to travel around the US presenting my research including at the 2024 American Society of Engineering Education Research Conference in Portland, Oregon. I was also awarded runner-up at the UNL Summer Research Symposium for Best Poster and Best Visual!
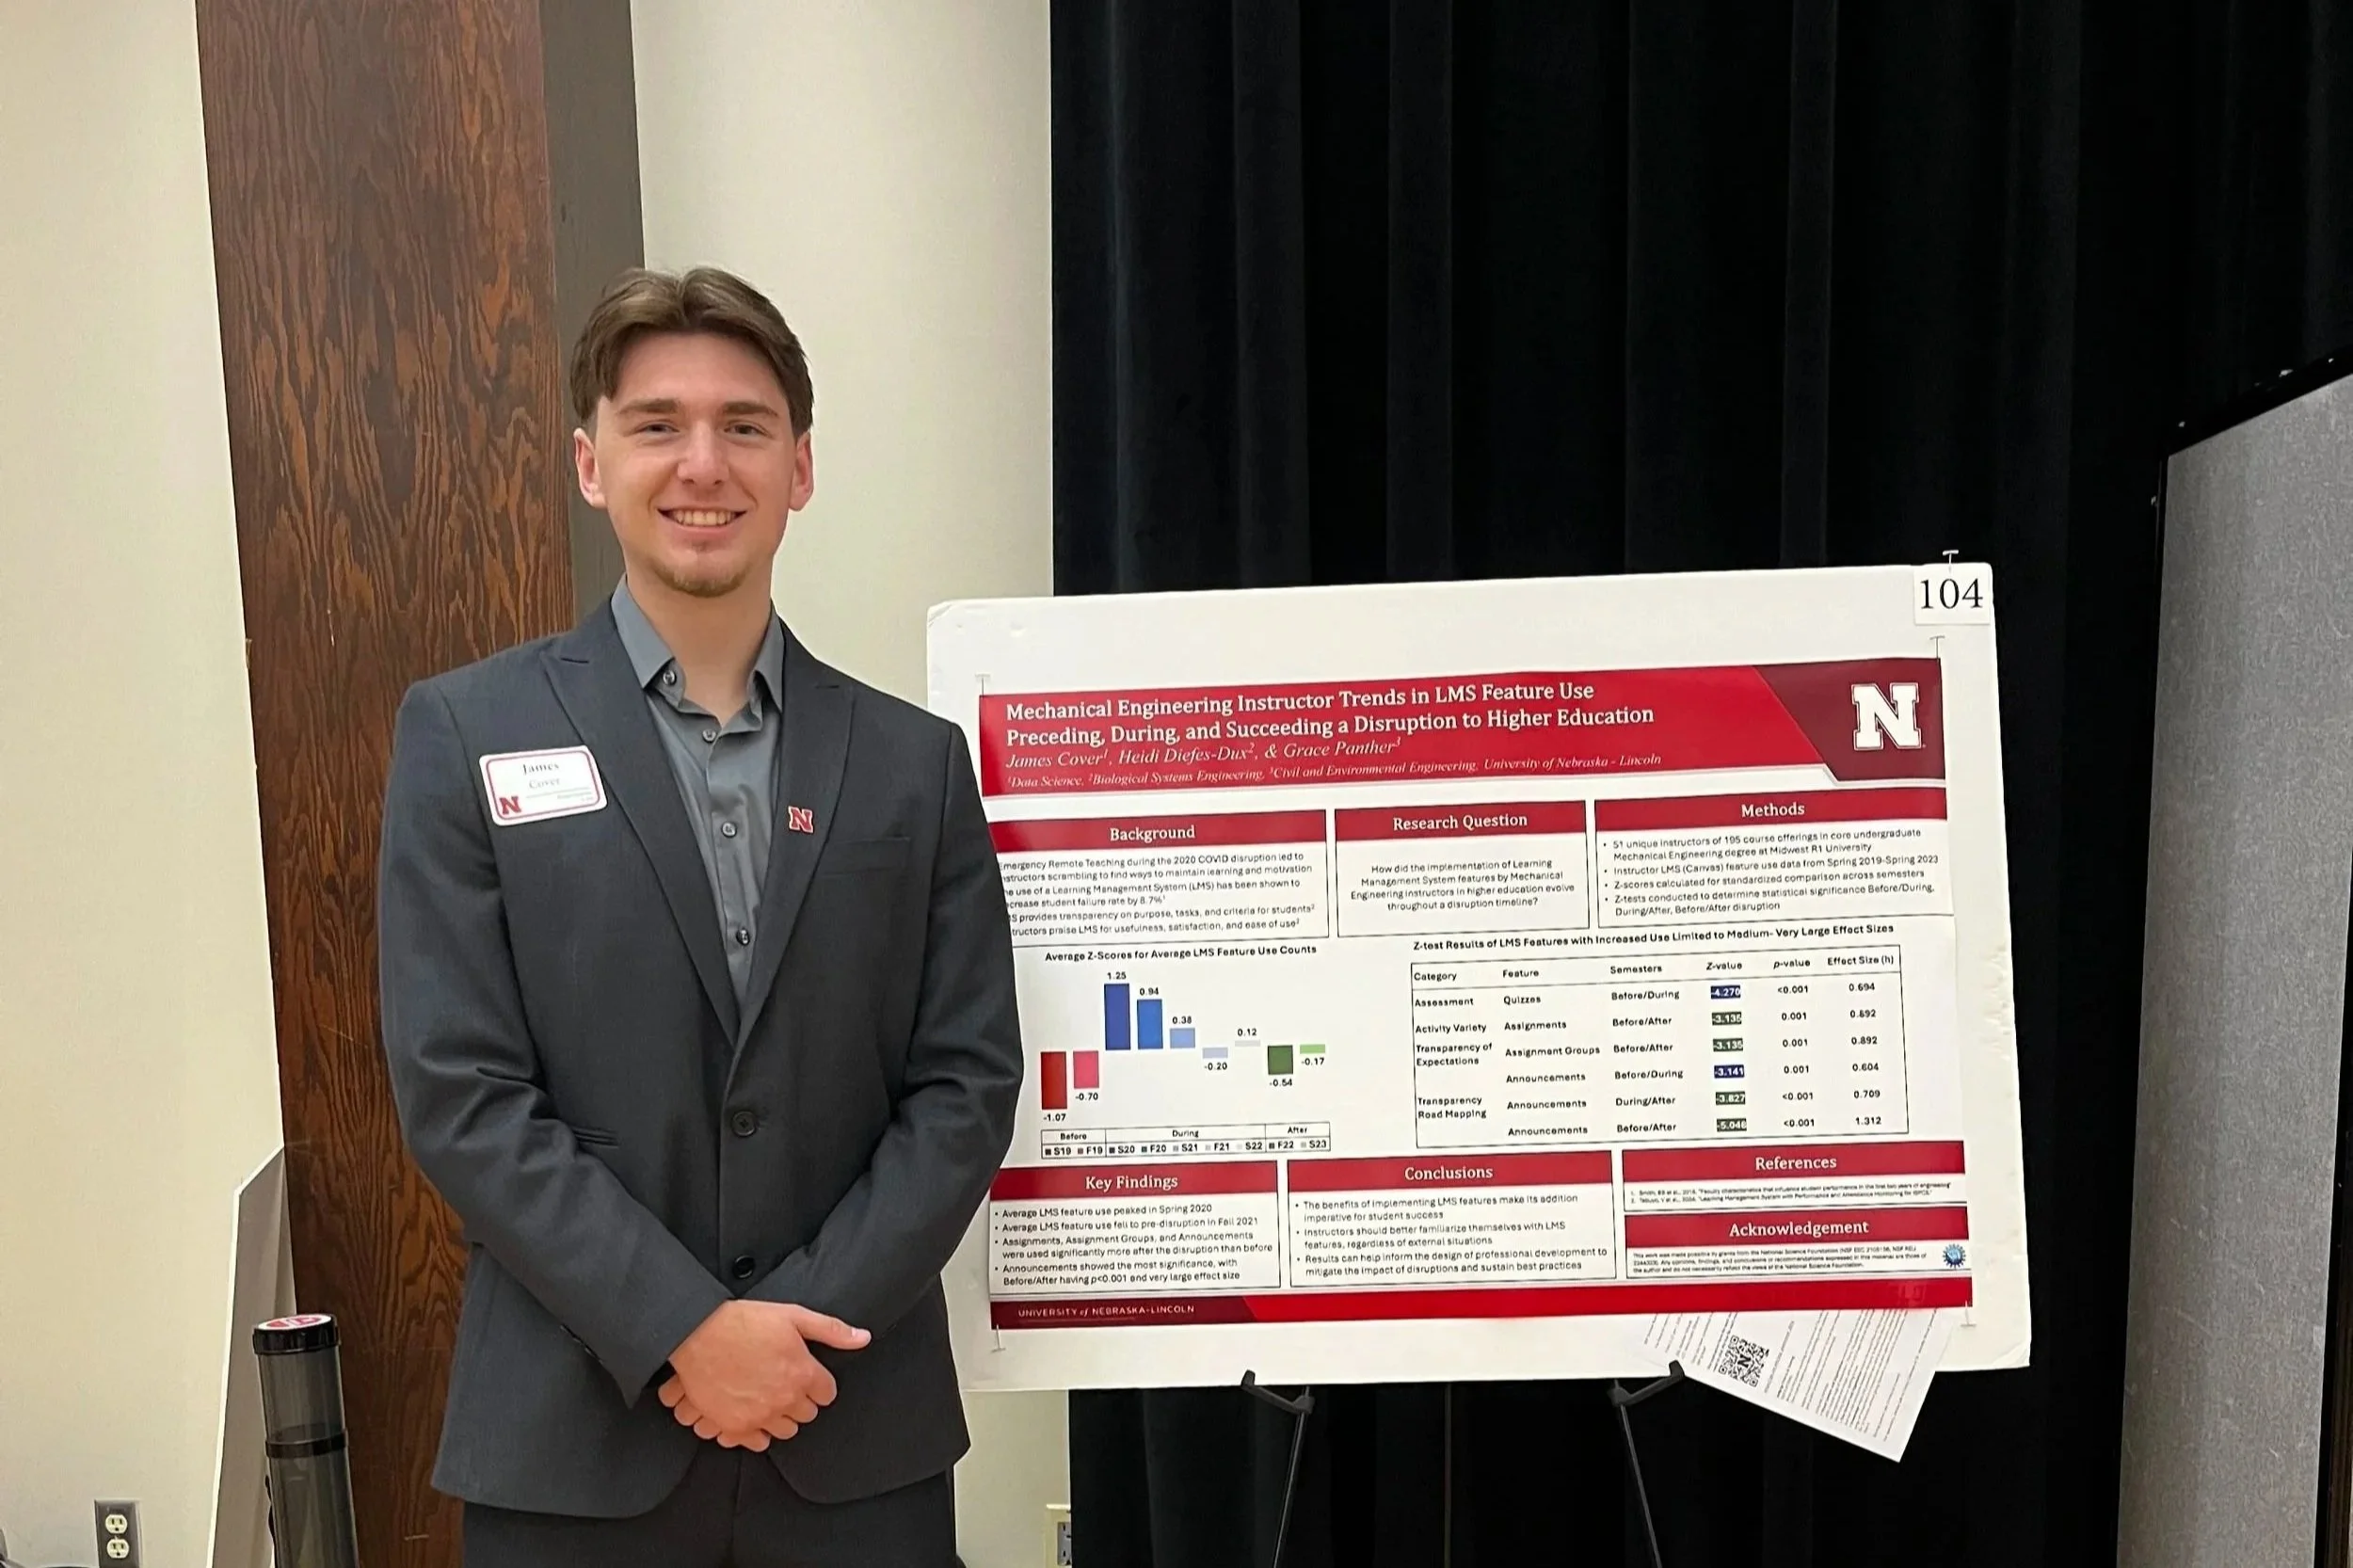

2024 DBER Research Poster
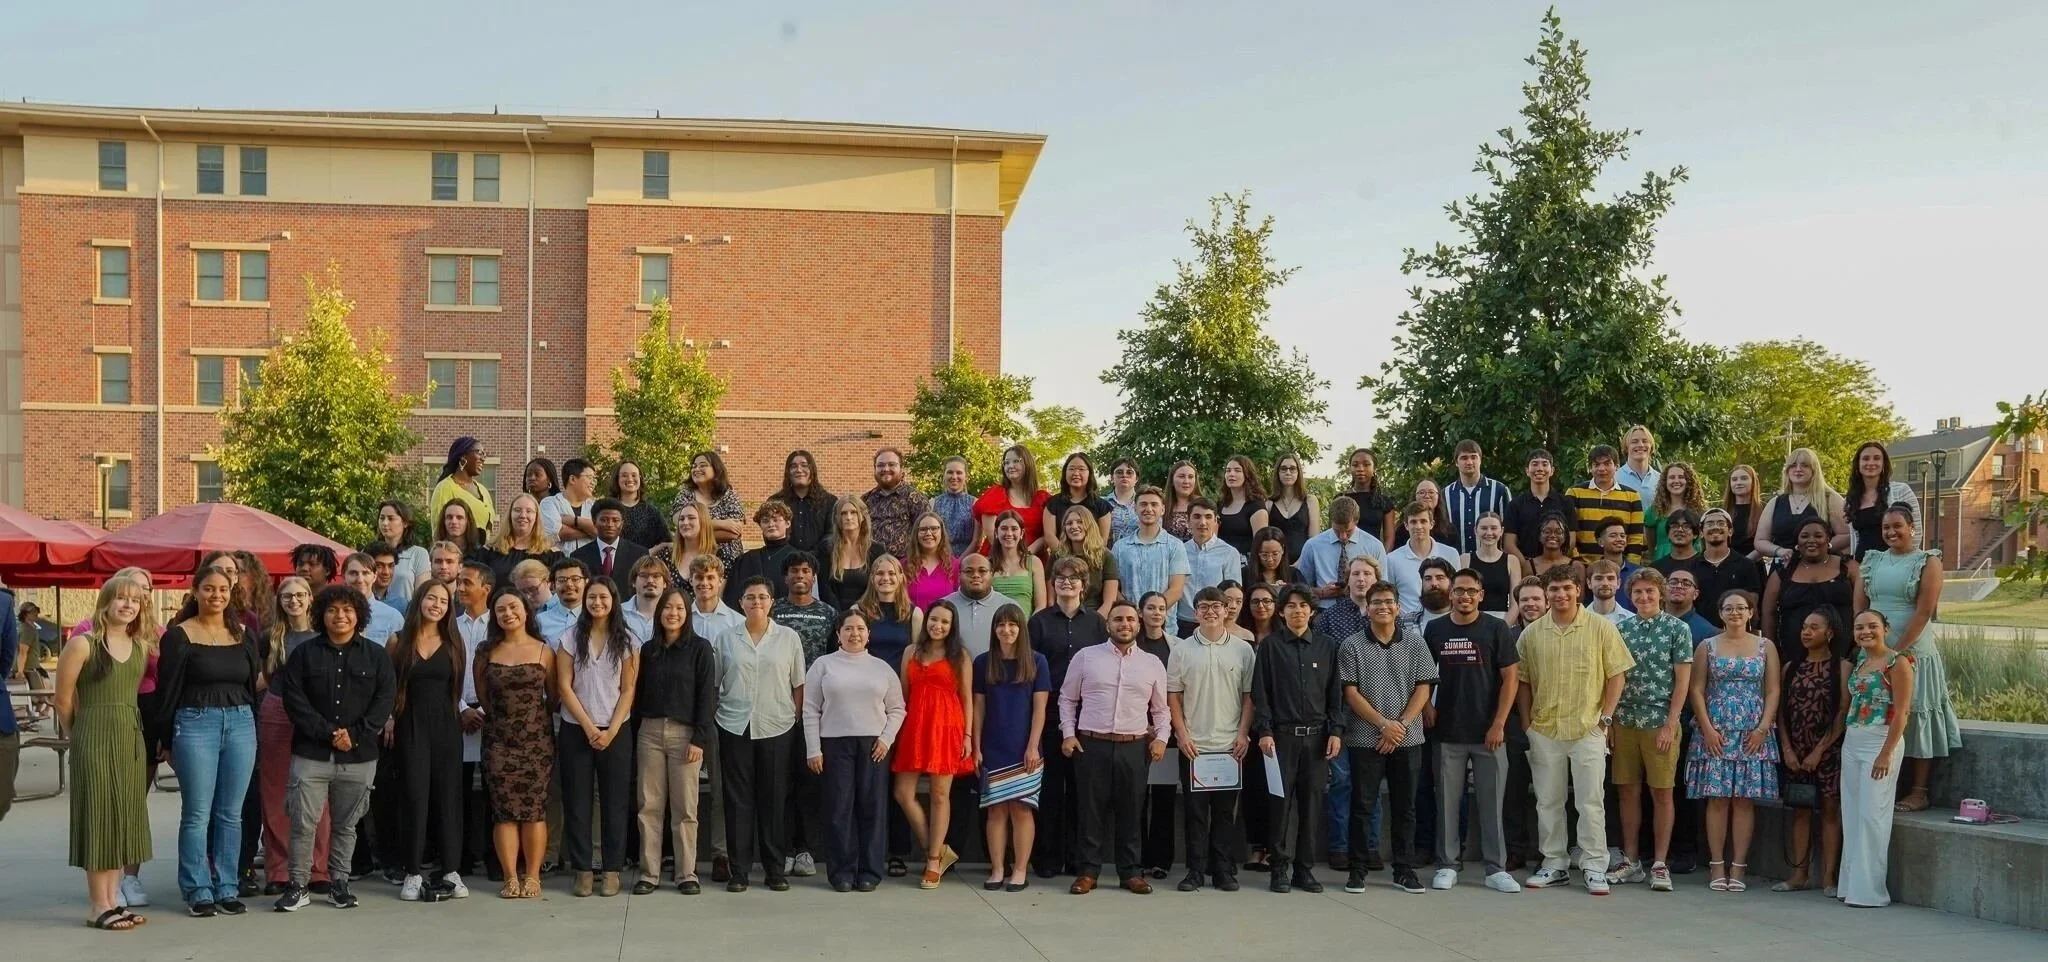
Engineering Education Research Undergraduates!
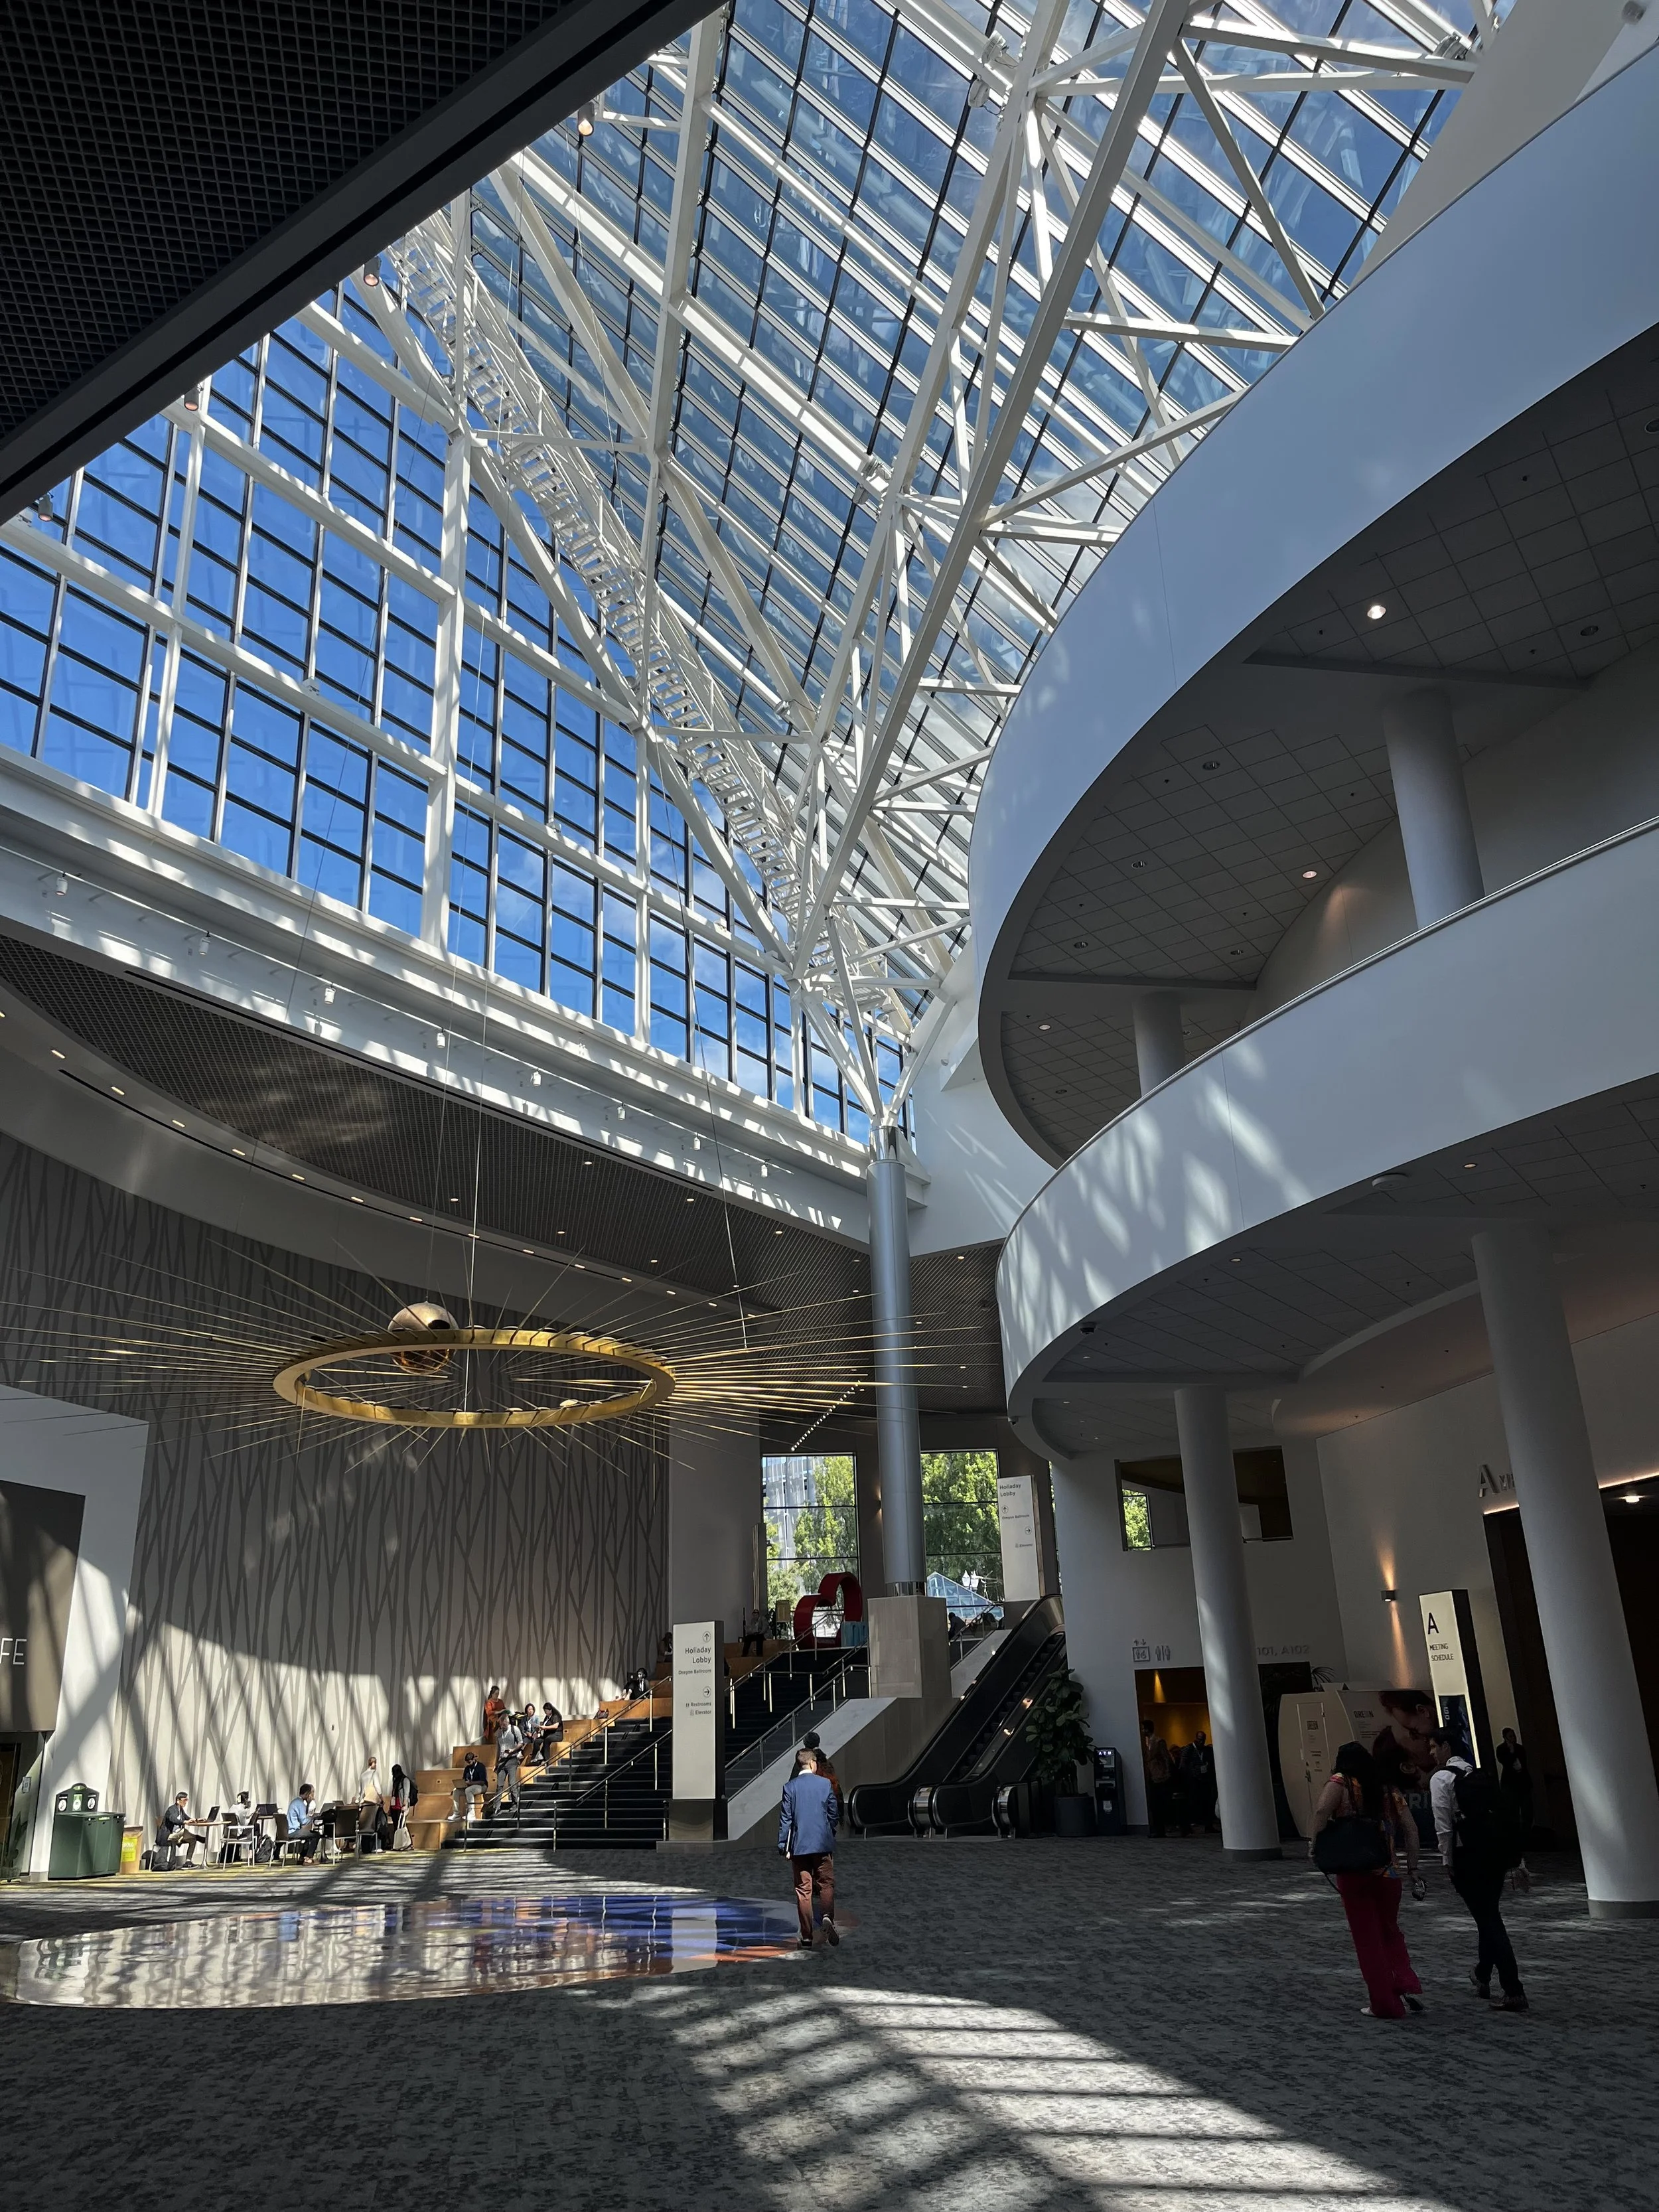
Oregon Convention Center in Portland, Oregon!
UNL Summer Symposium